
Welcome to RAC’s Weekly Traffic Dashboard. On this page you’ll find information on the latest rail traffic trends, including a breakdown by commodity: grain & fertilizers (incl. potash); intermodal; forest products; automotive; coal; metals and minerals; and energy, chemicals and plastics.
New data released every Tuesday – stay up to date with an email subscription.
Canadian Class 1 Freight Traffic
Last updated on June 16, 2026
In week 22 of 2026 (May 31 – June 6), Canadian Class 1 (CN and CPKC) network-wide carloads were flat while revenue ton-miles (RTMs) increased by 3% compared to the same week in 2025. Across their North American networks, carloads and RTMs increased for grain & fertilizers; forest products; and energy, chemicals and plastics, while decreasing for intermodal; and coal. Automotive carloads were down while RTMs were up. Carloads of metals and minerals were up while RTMs were down.
Across the first 22 weeks of 2026, Canadian Class 1 network-wide carloads were flat while RTMs were up 3% compared to the same period in 2025 (+365 carloads and +6,564 million RTMs). Growth was driven by increases of grain & fertilizers (+63,451 carloads, or +10%; +7,689 million RTMs, or +12%), followed by energy, chemicals and plastics. These gains were partially offset by reductions in coal; forest products; and metals and minerals. Automotive and intermodal year-to-date RTMs remain higher compared to the same period in 2025 though carloads are still down—indicating an increase in the average length of haul.
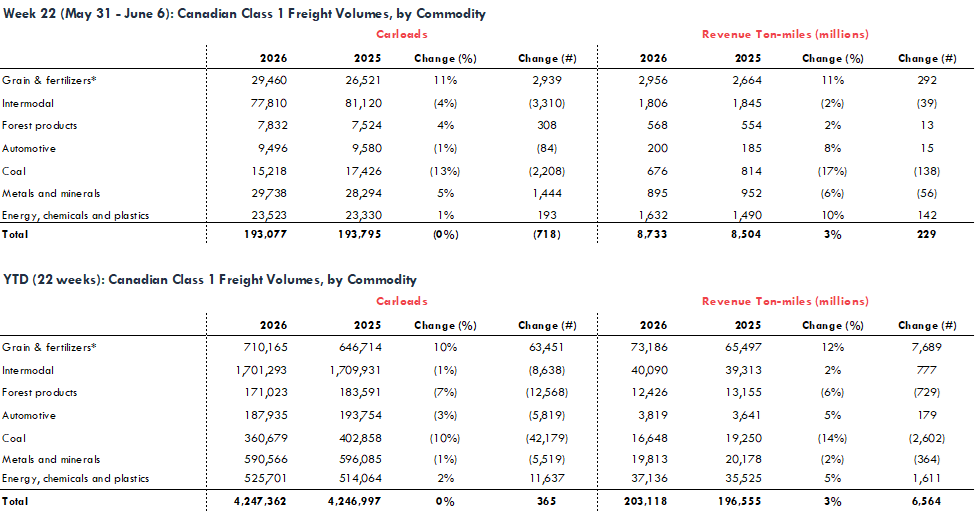
* Includes potash.
The figure below shows Canadian Class 1 network-wide traffic in each week. When temperatures drop below -25 Celsius, railways are required to implement train length and speed restrictions to maintain safety, which unavoidably impact supply chain velocity and capacity. Extreme cold also impacts other parts of the supply chain. For example, terminal loading and unloading by railway customers often slows during extreme cold.
In February 2025, railway operations were impacted by persistent, extreme cold in the three reporting weeks spanning February 2 to February 22. Temperature data from select cities (including Thunder Bay, Winnipeg, Regina, Saskatoon, Edmonton, and Calgary) show that temperatures dropped below -25 Celsius in 19 of 21 days in at least one of those locations, compared to just 1 of 21 days in the same period in 2024.
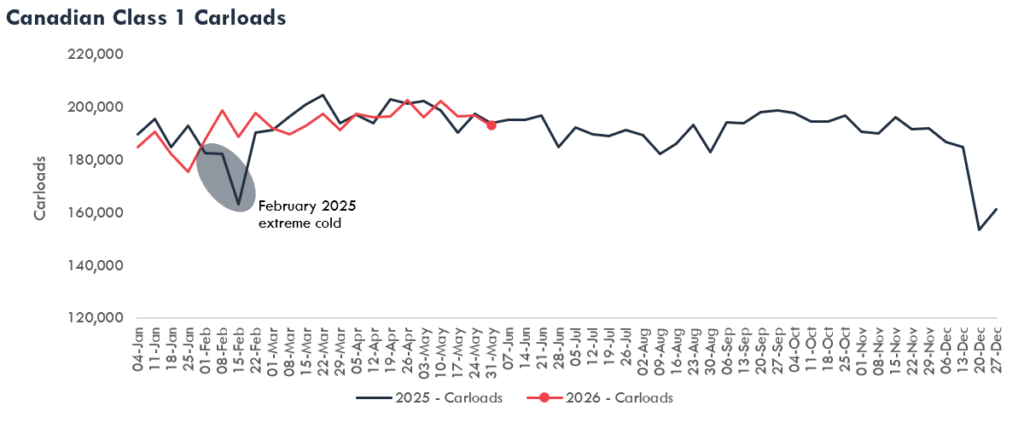
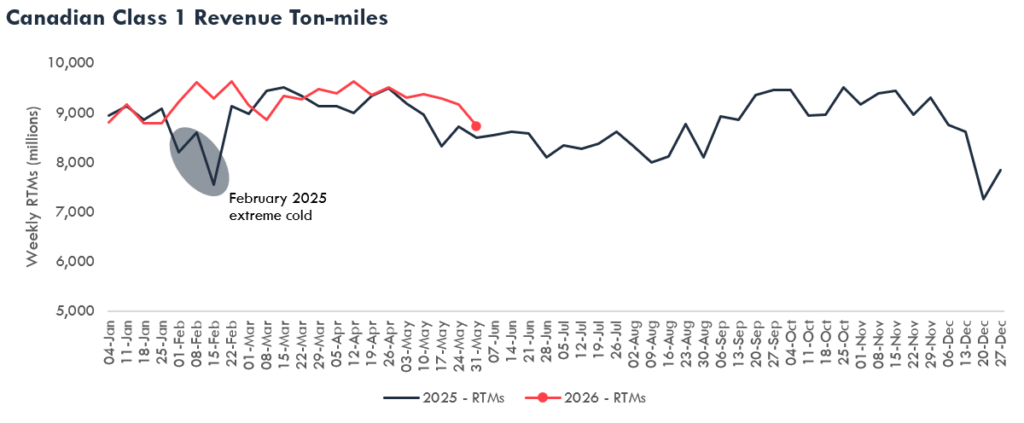
The dates indicate the first day of the week (e.g., “04-Jan” corresponds to the week of January 4 to 10). Canadian Class 1 data includes the network-wide operations of CN and CPKC.
Western Canadian Grain
In the 2024-2025 crop year (August 2024-July 2025), CN and CPKC moved 58.6 million metric tonnes of Canadian grain and grain products – 22% higher than the previous 3-year average.
In Week 44 (May 31 – June 6) of the 2025-2026 crop year, CN and CPKC moved nearly 1.1 million metric tonnes of Canadian grain and grain products.
Over the 2025–26 crop year to date, total shipments are up 13% compared to the previous 3-year average.
Crop year-to-date grain volumes (44 weeks)
54.4 million metric tonnes | +13% vs previous 3-year average
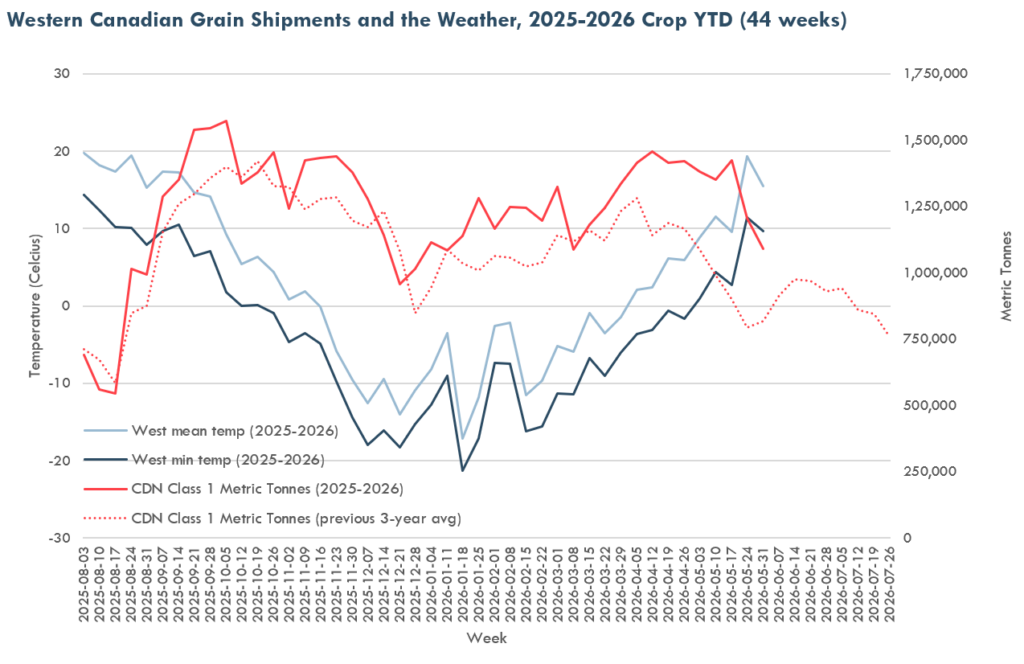
Notes: Data on Canadian grain shipments combine volumes from CN’s Western Canadian Grain Report and CPKC’s Canadian Grain Performance Scorecard. Weather data are from Environment and Natural Resources Canada. West min temp and West mean temp are calculated as the average temperature of cities throughout the Western Canadian Grain Supply Chain, including Thunder Bay, Regina, Saskatoon, Edmonton, Calgary, and Kamloops (Vancouver was omitted because temperatures there are not cold enough to cause significant supply chain disruptions).